Online Retail II Analytics
A modular retail analytics workflow for cleaning transactions, calculating KPIs, segmenting customers, and exporting decision-ready reports.
The context
From an interesting idea to an inspectable system.
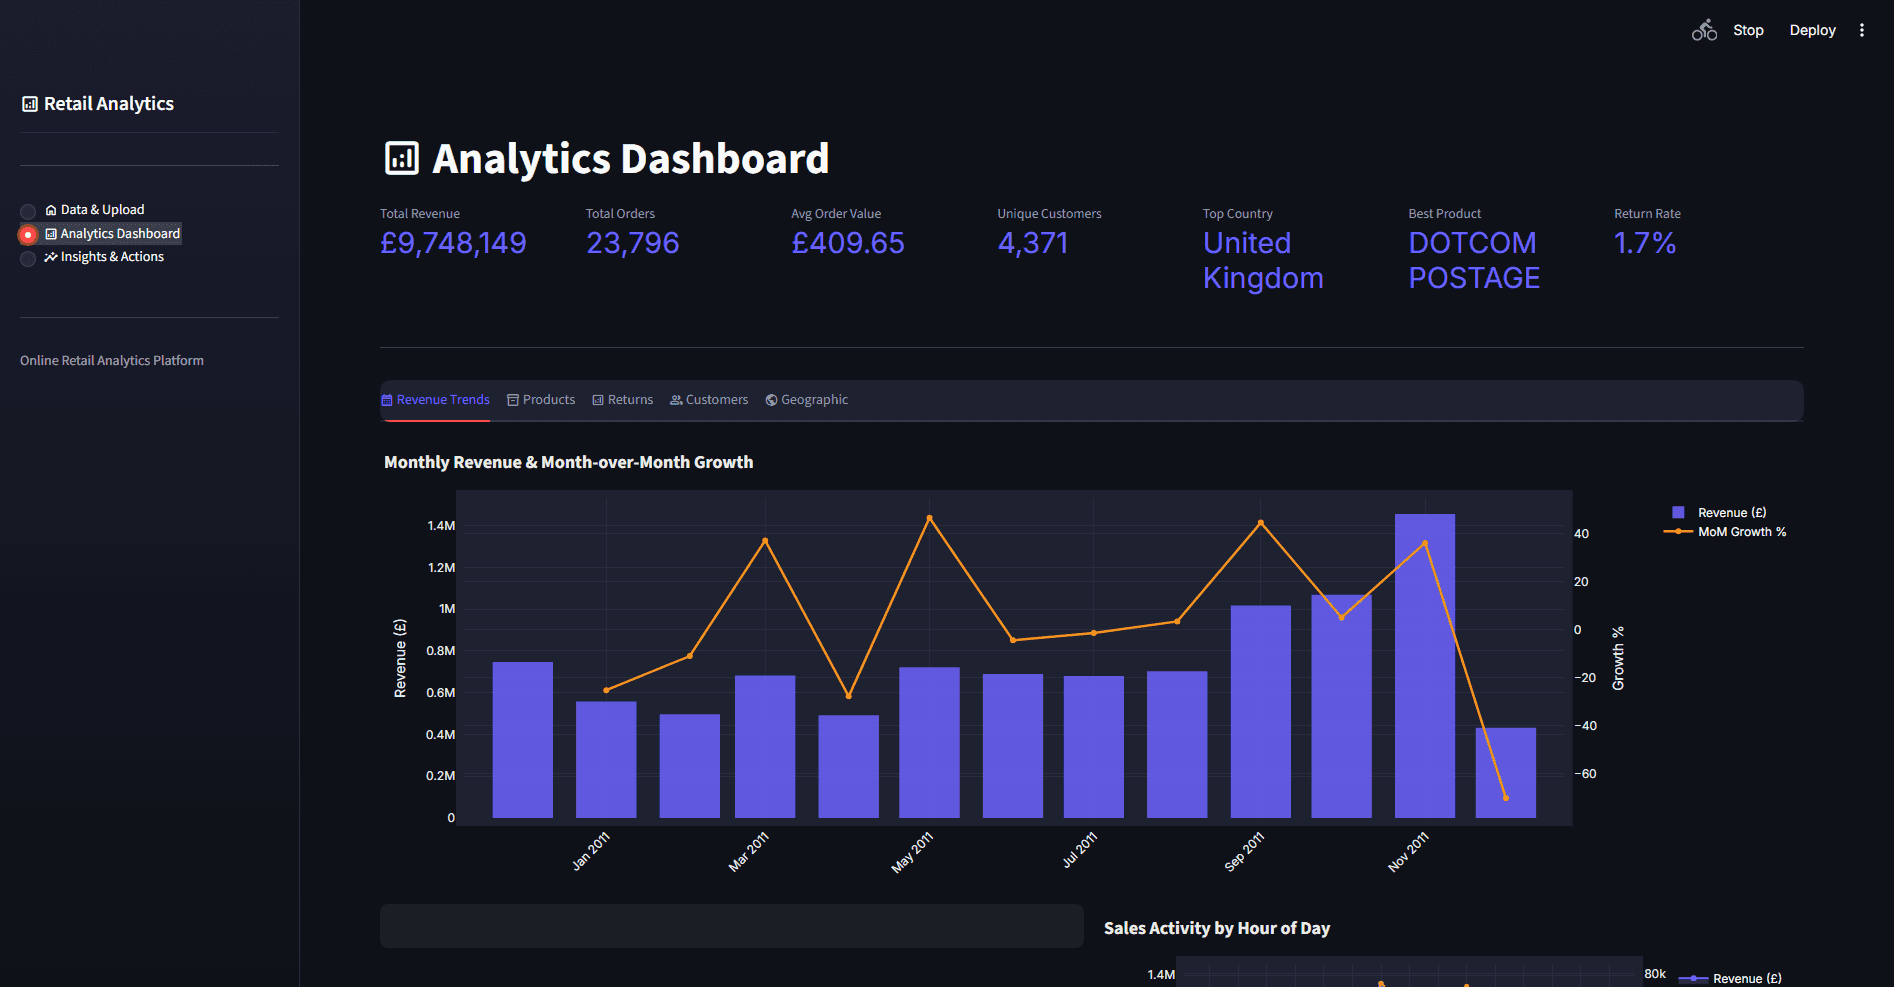
The UCI Online Retail II data is large, messy, and full of returns and incomplete customer records. The project turns it into reusable analysis modules and a multi-view dashboard for sales, customer, product, and geographic exploration.
My contribution
What I built
- 01
Built reusable cleaning, KPI, visualization, RFM, recommendation, and Excel-export modules.
- 02
Created six dashboard views covering data intake, revenue, products, customers, geography, and actions.
- 03
Implemented RFM segmentation, churn-risk exploration, rule-based recommendations, and an assumption-driven scenario simulator.
- 04
Added a 29-test suite covering the core data and recommendation behavior.
Architecture
How the work moves
Evidence
Documented results
Honest evaluation
Limits and trade-offs
- No public live demo was documented at the time of the audit.
- The seven-card KPI row needs responsive layout work at common laptop widths.
- What-if outputs are arithmetic scenarios based on chosen assumptions, not causal forecasts.
- Recommendation impact percentages are rule-based estimates, not measured business outcomes.
Inspect the work
Stack and reproduction
- 1Install requirements.txt.
- 2Run streamlit run app/app.py.
- 3Load the committed cleaned demo dataset from the app's data-upload view.